FROM 31/01/25 INTERACTIVE SESSION
This was the VERY FIRST TIME that this information has been written or uttered by me EVER!
It was first deduced by me back in 2019. Much of the information I 'KNEW' back then is NO LONGER IN MY HEAD; at least, not right now.
But what I remember EASILY STILL NOW, you will find logged below:
[18:40]
I have been unable to resolve the issues I am currently facing, but nevertheless, I shall post the key information relating to the scientific information - but in highly abbreviated fashion.
SINGLE LINE UPDATES!
AND THIS RELATES TO HOW OUR EYES WORK
The Cones in our eyes effectively process ONLY HUE information.
It is the Cones in our eyes that process BRIGHTNESS & SATURATION information.
If you imagine a square wave, then the more vertical [bright] lines in the wave, the brighter the colour that will be observed by the Rods, whereas the few the lines, the darker the colour.
This will effectively look like a black and white tv.
[18:55]
If you imagine a square wave, then the more vertical [bright] lines in the wave, the brighter the colour that will be observed by the Rods, whereas the few the lines, the darker the colour.
This will effectively look like a black and white tv.
The 'colours waves' are effectively 'traced out' by these line blocks of the black and white rods, and hence, they will respond to the different shapes. That is to say that the colour waves are essentially superimposed onto the black and white signal.
[18:57]
What's more, it is HIGHLY LIKELY that a COLOUR BLIND PERSON will STILL observe a FULL SET OF STRIPES ON THE SPECTRUM; i.e at least, A FULL SET OF SORTS.
SO LONG AS THEY ARE VIEWING THE LIGHT UNDER FAVOURABLE CONDISTIONS!
[19:02]
Essentially, the red colour is MORE THAN LIKELY TO HAVE BEEN SHIFTED INTO THE INFRA-RED RANGE, meaning that MANY these people will MORE THAN LIKELY BE ABLE TO PERCEIVE INFRA-RED BETTER.
And there have been CERTAIN STUDIES are CERTAIN TRIBES with ESSENTIALLY THE SAME CONDITION; BUT NOT PERCEIVED AS COLOUR BLINDNESS.
[19:07]
When we are viewing and mixing lights through filters, we are TAKING OUT THE GREYSCALE INFORMATION ALSO, meaning that we lose all the saturation information; this is why they will behave differently
And thus, we end up with different versions OF ESSENTIALLY THE SAME COLOUR
But this is not yet THE BIGGEST MISCONCEPTION!!
[19:15]
That is to say that IT IS HIGHLY LIKELY THAT ALL OF OUR CONES PROCESS ALL OF OUR COLOURS!
ALL 7 OF THEM.
Black and white will be processed by the rods, as also will greys.
And ALL THE OTHER COLOURS are effectively WHAT YOU SEE IN THE SPECTRUM.
NOT RED BLUE AND GREEN AT ALL! [Well, at least, NOT ONLY RED BLUE AND GREEN.
[19:25]
IT IS SUSPECTED THAT THERE IS ONE OSPIN PROTEIN FOR EACH COLOUR WE PROCESS;
[19:27]
And that the manner in which THESE PROTEINS process the light rays [or at least, light ray signal information] is what dictates what colours [or proportion thereof] we perceive.
[19:35]
There are various other aspects that I SIMPLY CANNOT REMEMBER RIGHT NOW!.
This was ALL OBSERVED IN 2019 or so, and I SPECIFICALLY DID NOT WRITE ANYTHING DOWN, NOR DID IS SAY ANYTHING OUTLOUD! NO NOTES; NOTHING.
CLEARLY NOT AN IDEAL WAY TO WORK OR PROGRESS!
BUT THIS IS WHAT I HAVE BEEN FORCED TO DO FOR MORE THAN HALF A DECADE.
And so, AGAIN, THIS TOO will have ensured that NO WHERE NEAR AS MUCH PROGRESS AS COULD HAVE BEEN ACHIEVED 'WOULD NEVER BE ACHIEVED'.
.....and as for those missing [forgotten bits / information not in my head right now], well, that will have to wait until ANOTHER DAY.... ...OR POSSIBLY NEVER;
OBSERVING BLACK AND WHITE - VIA RODS
TBC
EXPLORING CONES AND COLOUR
The High-Frequency-Multiples Simplification Model (Scheme)
We want an easy way to compare different scenarios of frequency responses.
However, it is not very easy to work graphically with frequency modulation and the ever-changing frequencies that they constitute.
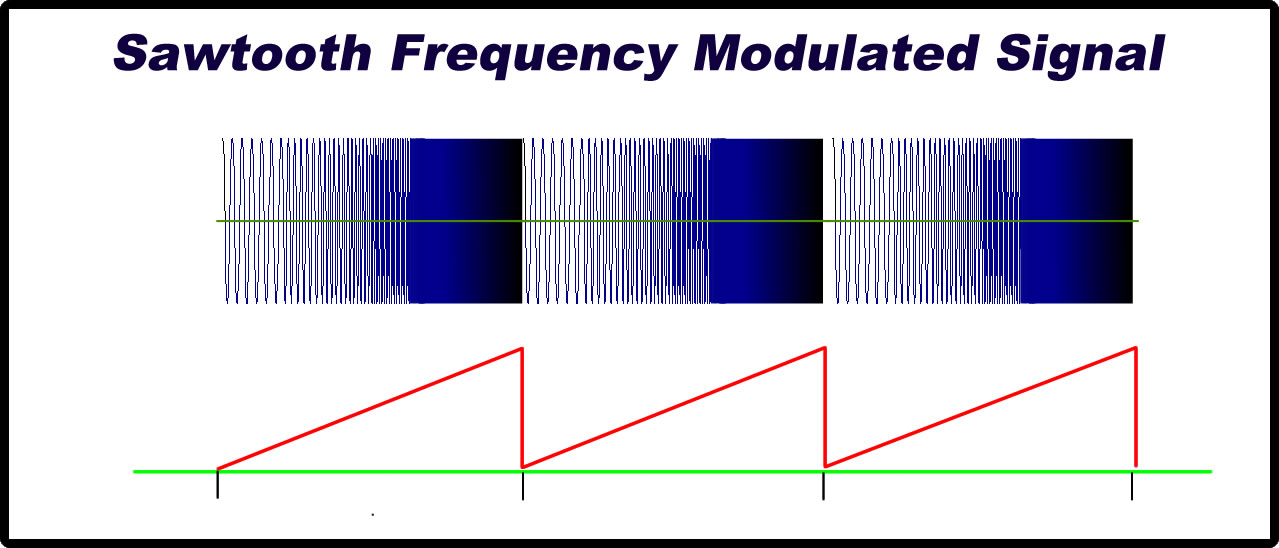
Fig 1
Thus, we shall create a means of simplifying our display PURELY FOR CONTRASTING PURPOSES, and we shall do this via a scheme that we shall call the HIGH-Frequency-Multiples Simplification Scheme / Model.
This model is based on the fact that once we enter into the high frequencies ranges, then we can be sure that there will be various different multiples of pretty much ANY AND ALL of the different frequencies that we might be interested in.
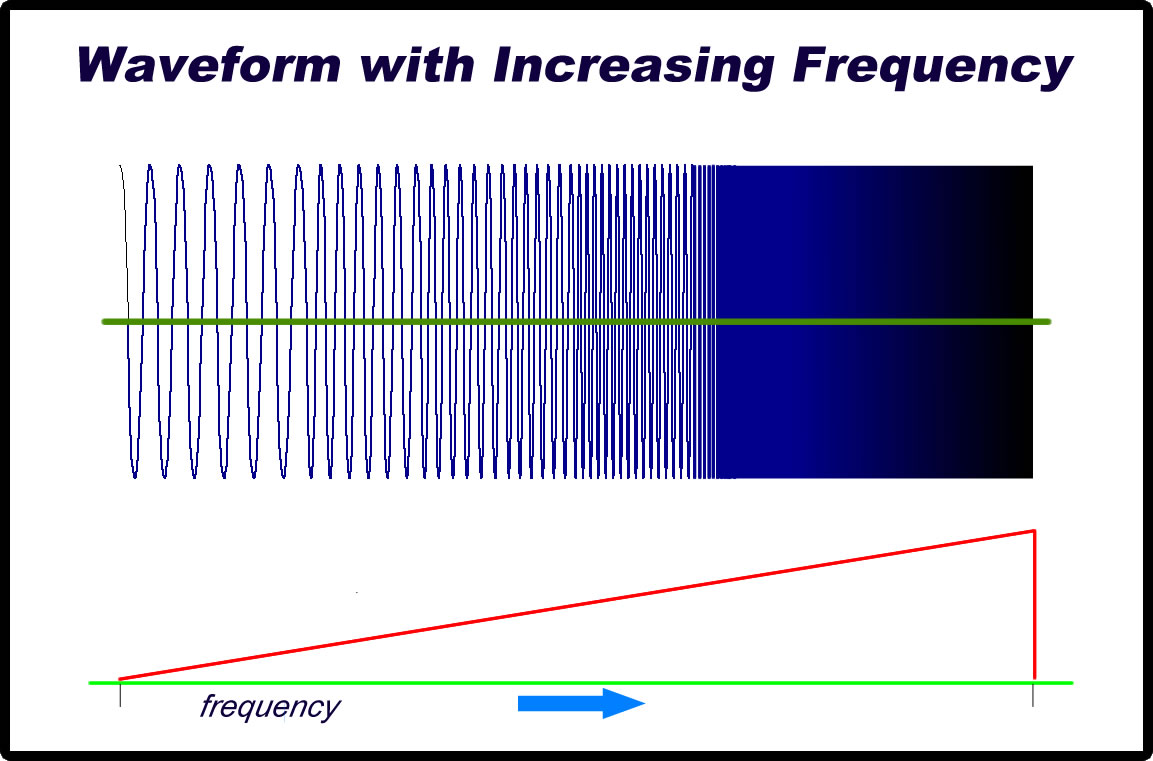
Fig 2
Thus, given that the wavelengths are too close to visually distinguish, whilst also bearing in mind that there will certifiably be these various multiples of interest on that region, then we are actually free to display whatever multiples we wish to, beyond the indistinguishable wave portions of our diagrams.
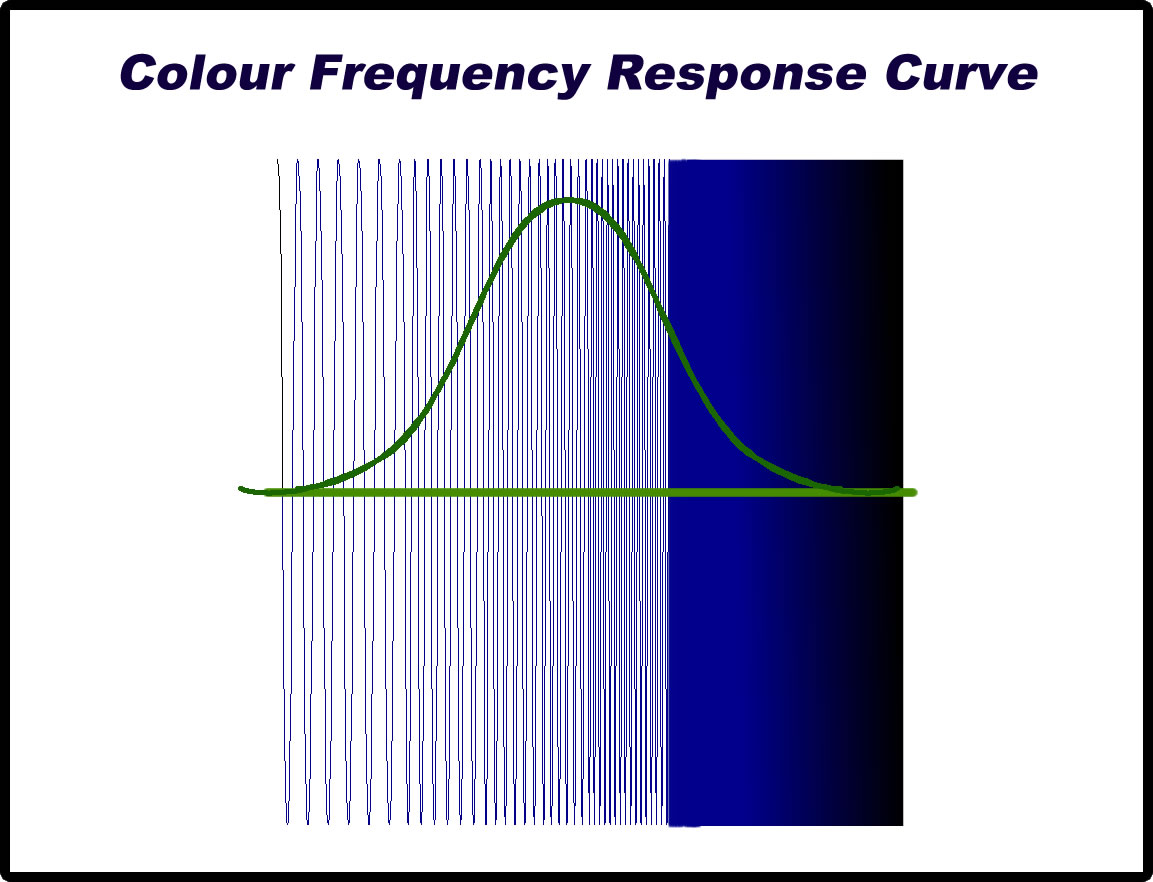
Fig 3 - Frequency Response Curve Overlaed on a Modulating Frequency Waveform
That is to say we could either leave it as a gradient block (as shown above) or alternatively we could place ANY specific wave patterns in that region that we desired.
What this then gives us is the option to place additional sets of very specific wave sizes / frequences (that happen to be of particular interest to us) WHEREEVER we want to place them in that region; PURELY for ease of display and visualisation purposes.
Thus, in our diagrams, we have chosen to display the actual wave modulation up to the half way point of the colour frequency response trace line, and then, beyond that point, we have simply placed a second wave [which we happen to have selected pretty much at random] in order to allow us to place the desired wave sizes / frequencies of interest EXACTLY WHERE WE CHOOSE TO, so as to allow the desired VISUAL COMPARISONS to be appreciated visually in that particular highlighted region of our diagram.
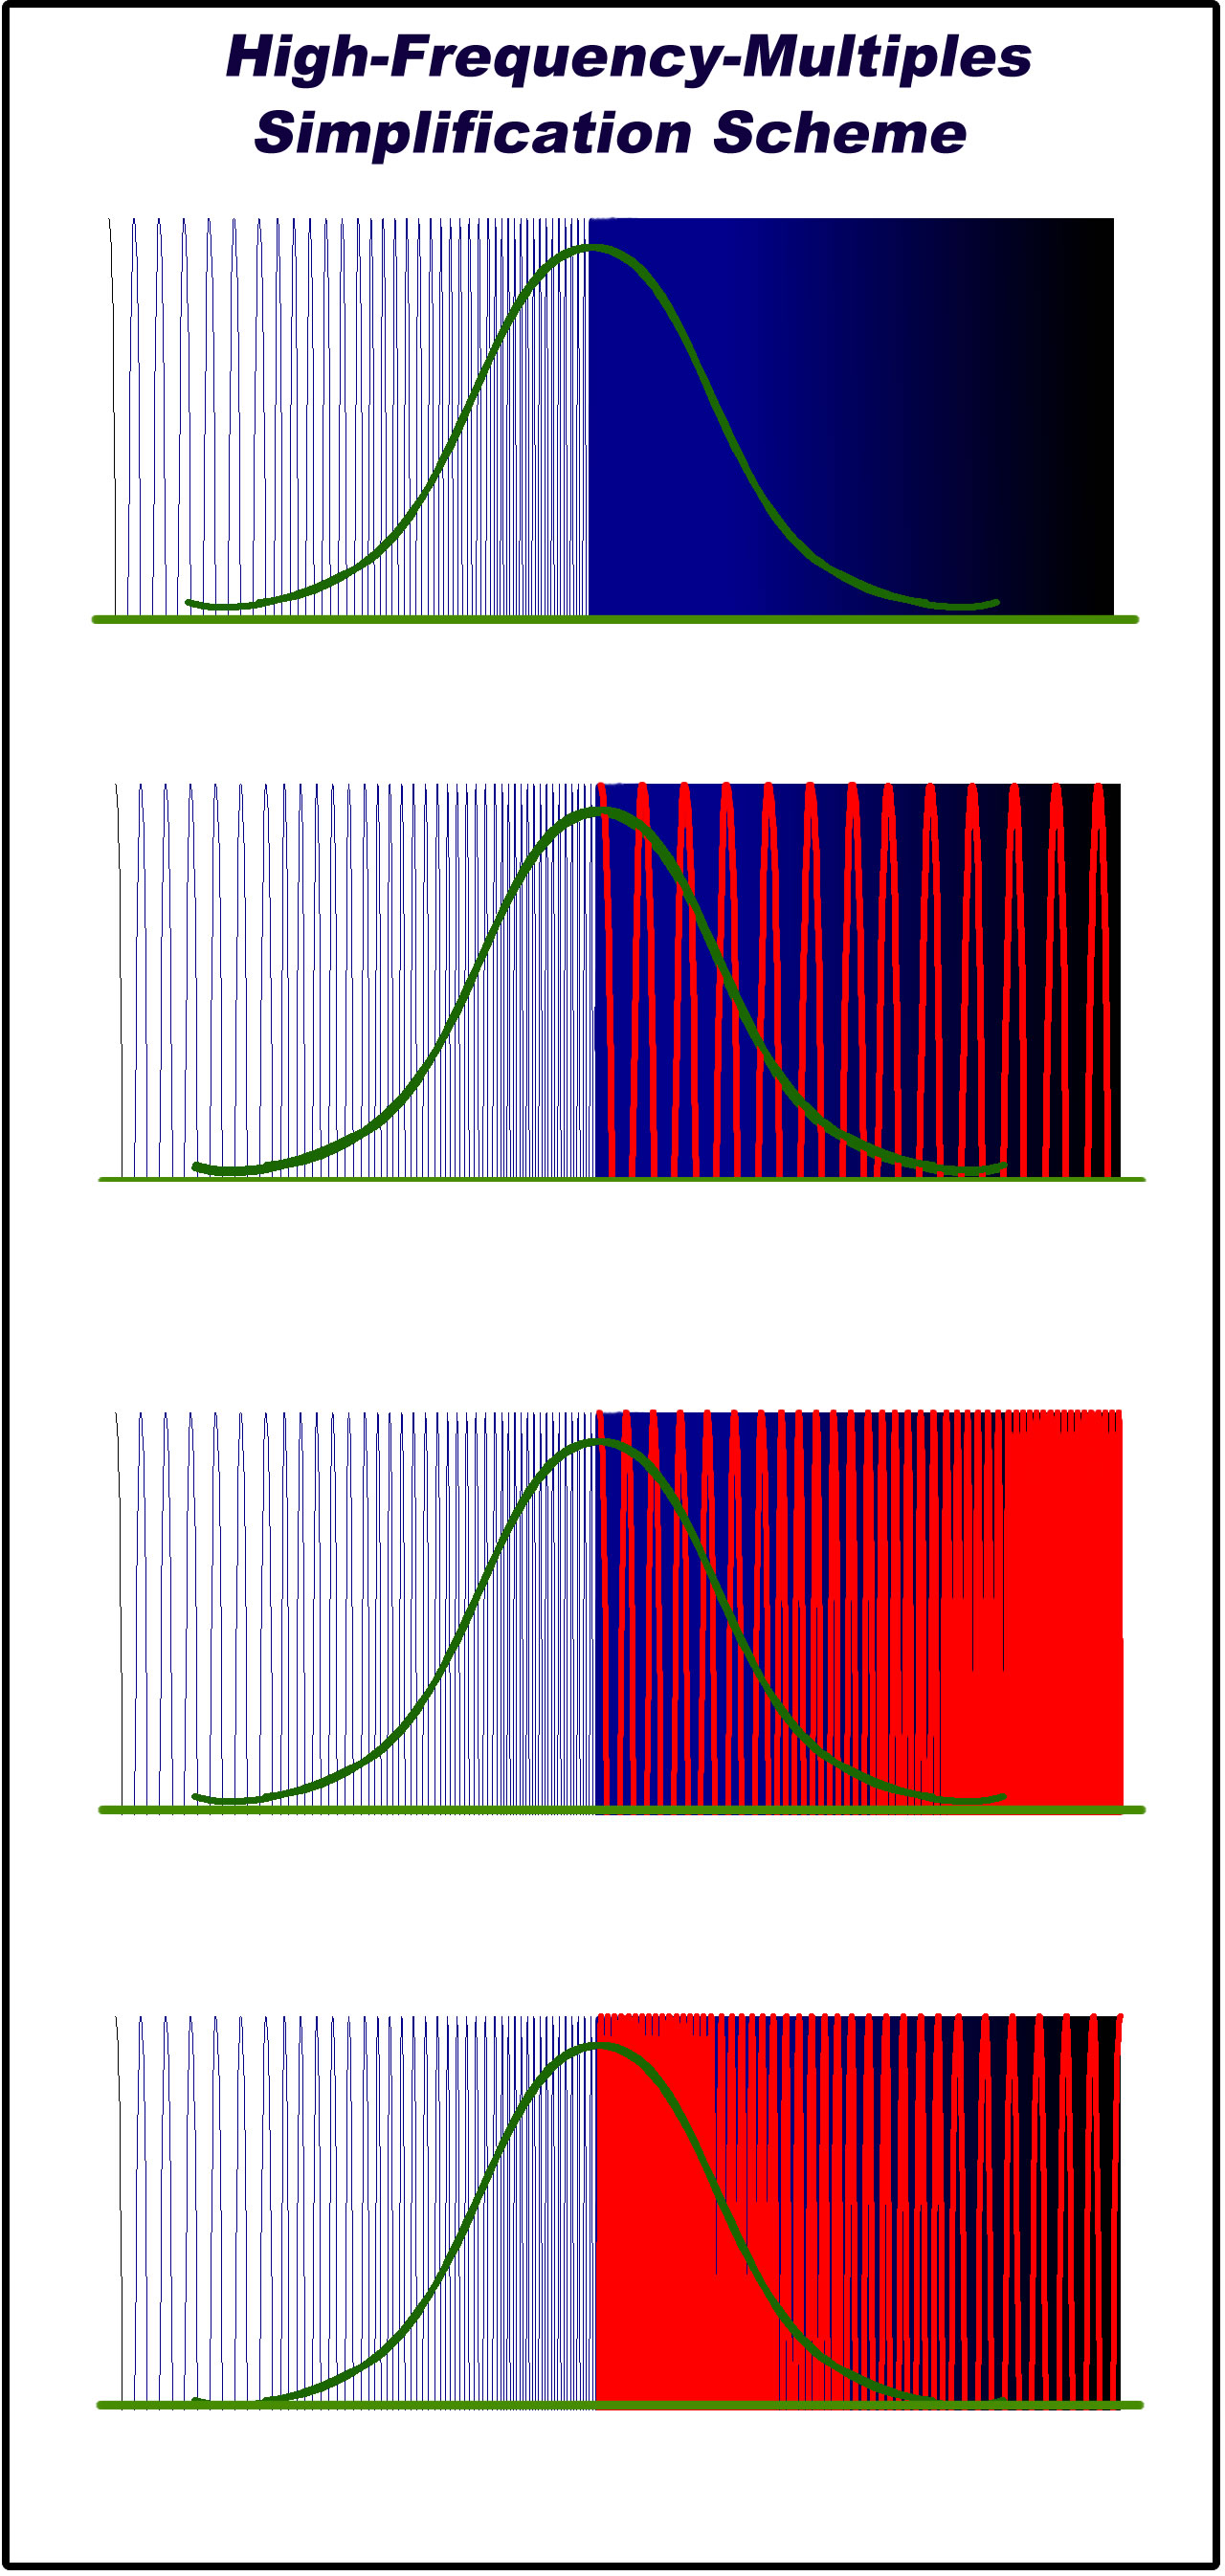
Fig 4 - High Frequency Multiple Simplification FREQUENCY RESPONSE Diagram
(with ABRITRARILY SELECTED WAVEFORM OVERLAY - specifically accoding to the needs of the current point of focuse)
And in that way, we can VISUALLY make the necessary connections and correlations and thereby, focus on the associated comparisons without having to worry too much about all of the actual intricacies, the accuracies and the measurements of the waveforms themselves.
And if we want to select a particular region of interest for a particular set of propeties or characteristics, then we can simply ARBITRARILY manipulate the waveform in that region in order to purposefully ensure that the necessary properties that we wish to focus on are present, visible and highlighted in that specific region of interest that we wish emphasise.
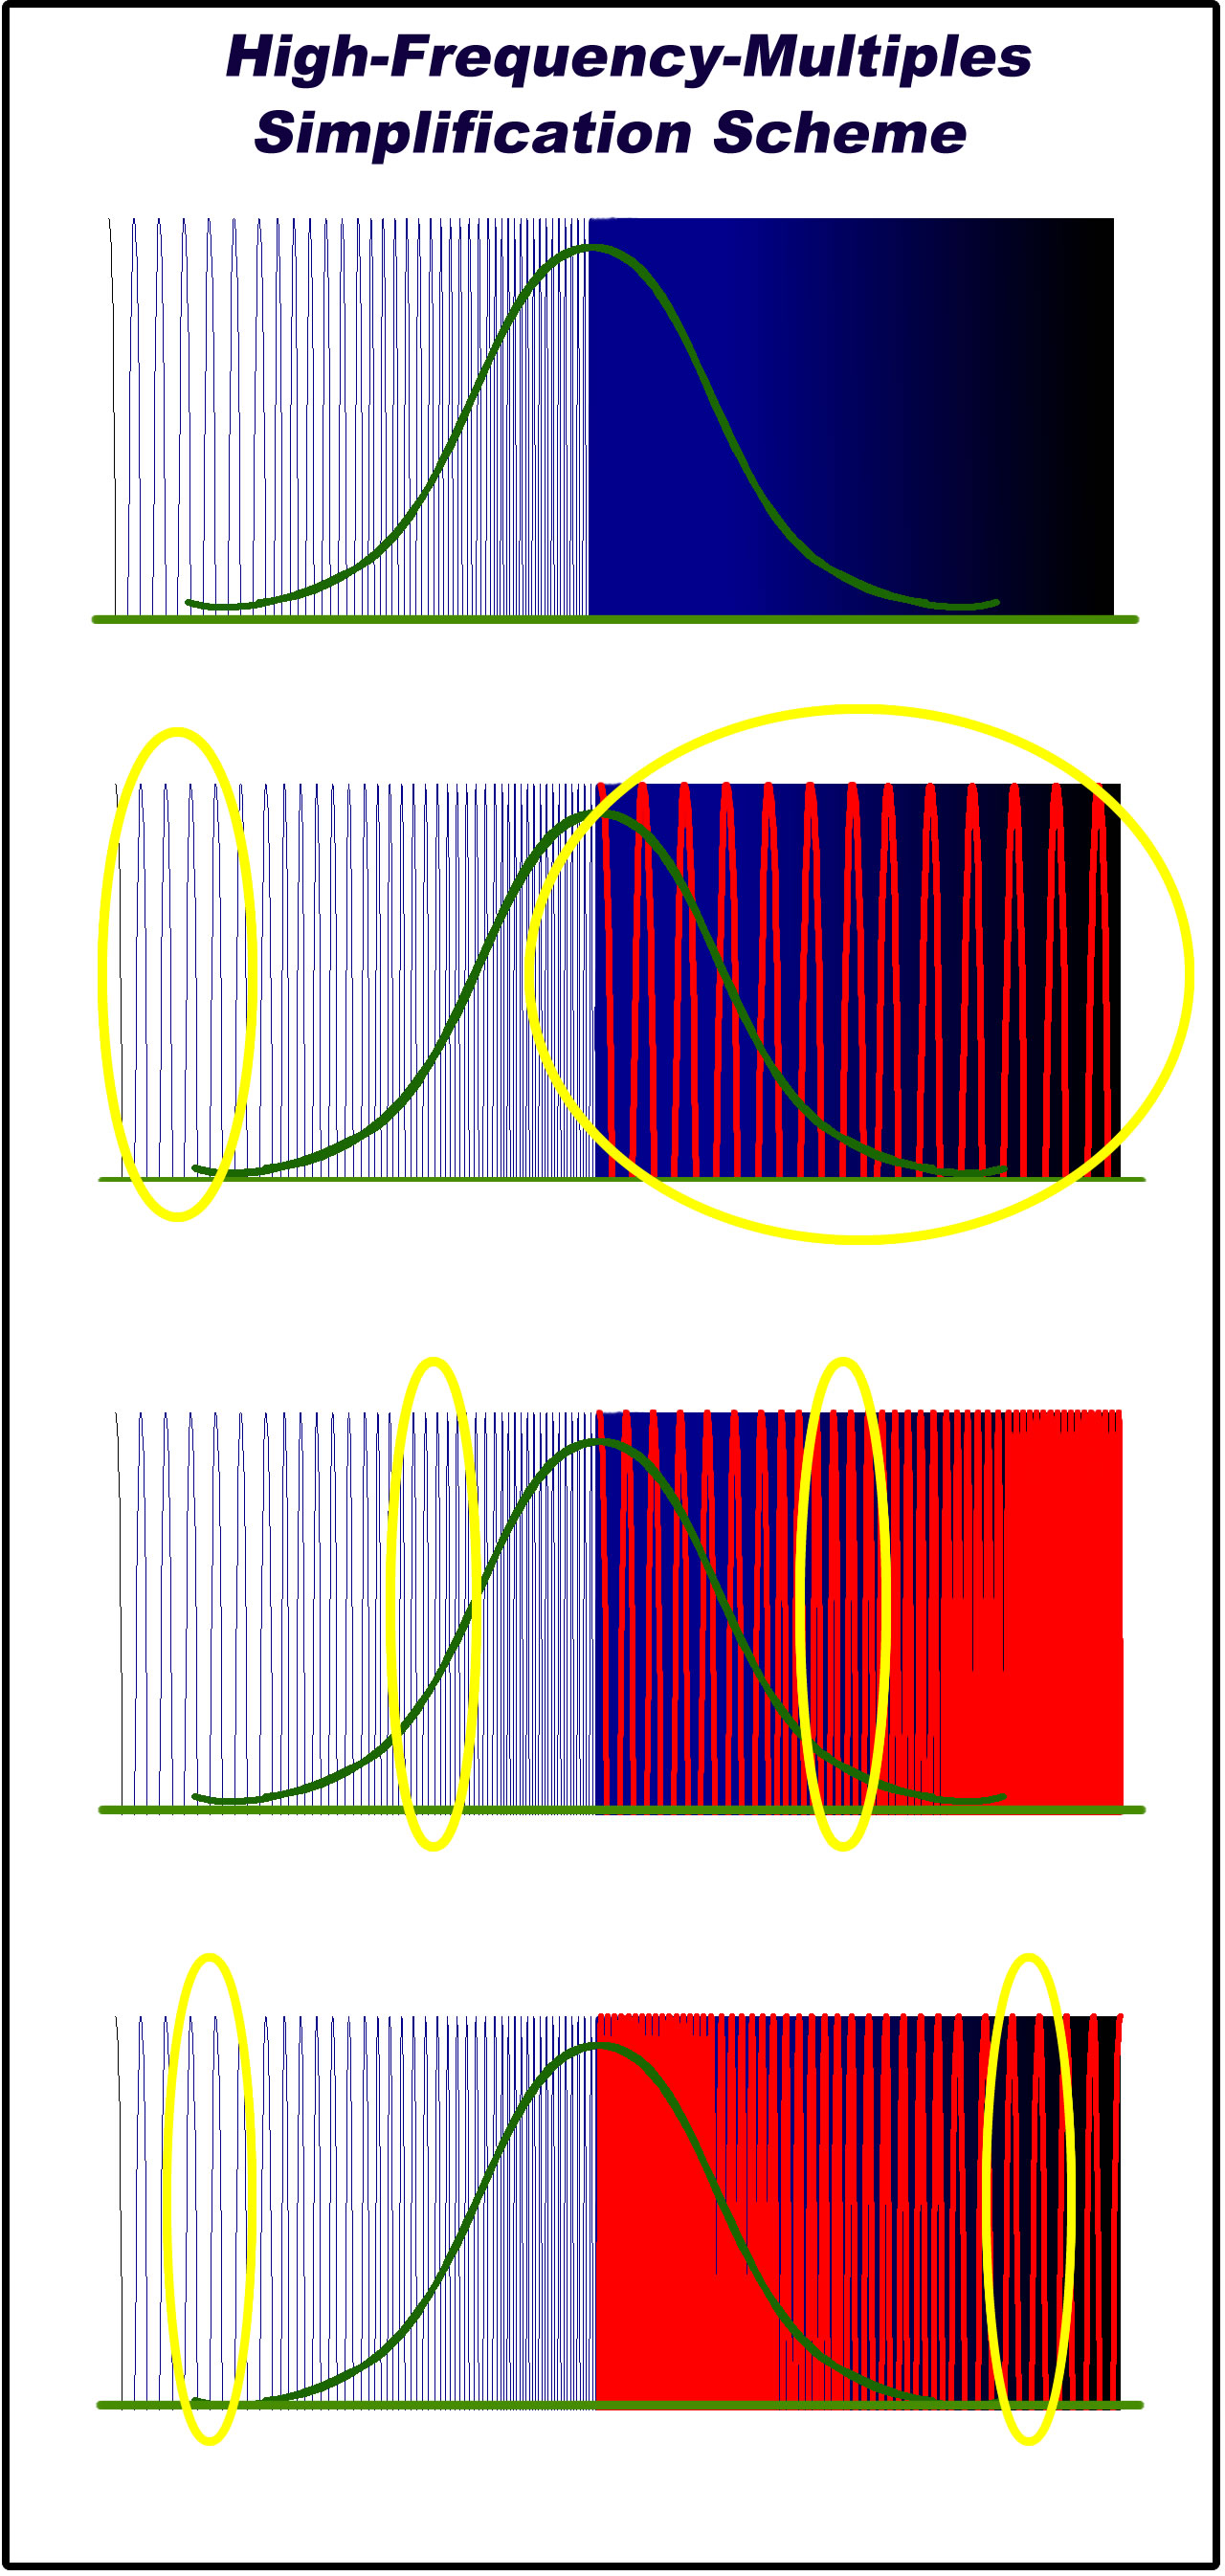
Fig 5 - High Frequency Multiple Simplification FREQUENCY RESPONSE Diagram
(Areas and Characteristics of Interest Determined and Highlighted)
Thus, that means that in image above [Fig 5.], we can assert that the regions of interest of the ACTUAL WAVEFORM are those shown in that figure, whereas in stark contrast, we can simply manipulate the waveform on the HIGHER FREQUENCY SIDE of the response diagram so as to then allow us to additionally focus our attention on the desired highlighted portions of that High Frequency region also. [ont the red waveform on the right hand side]
Thereby, our focus will be able to remain more on the properties of the waveform that WE WISH TO FOCUS ON rather than any of the other propoerties that could further be introduced to complicate matters far more than we actually need to for our purposes of discussion here.
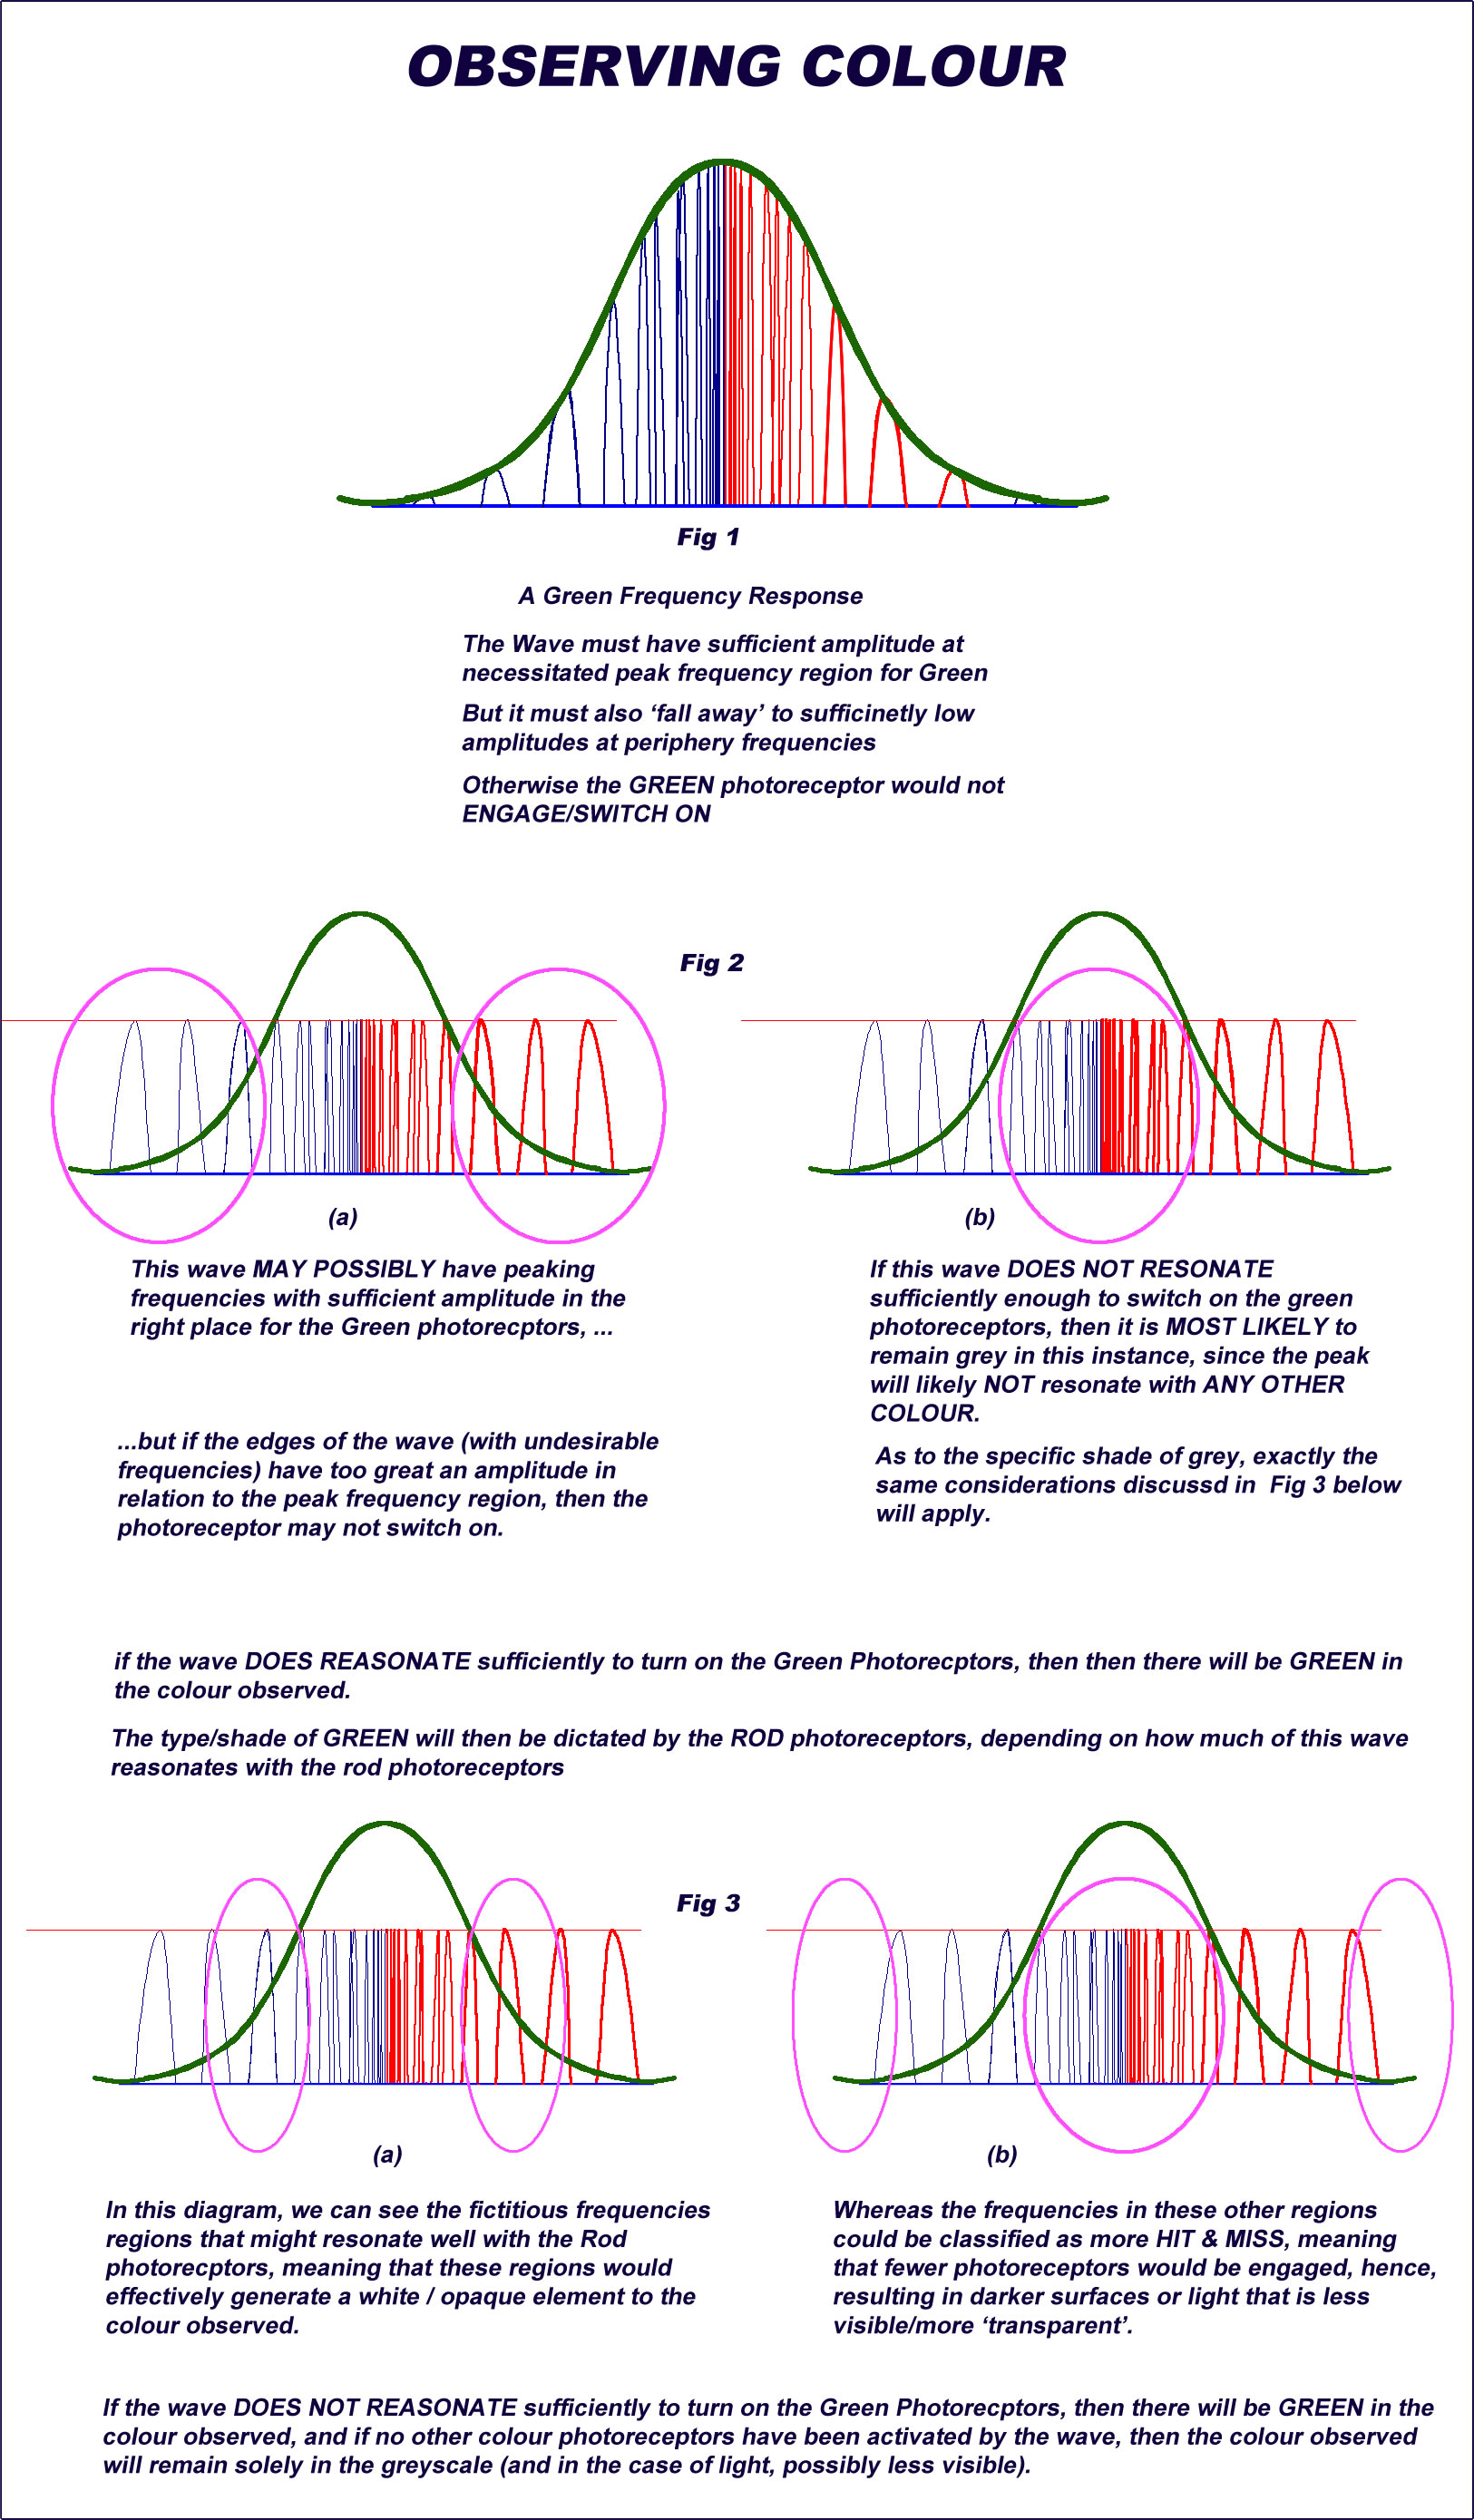
Picture #2 - Colour Observation - using colour-coded HFMS-Model
OBSERVING COLOUR- VIA CONES
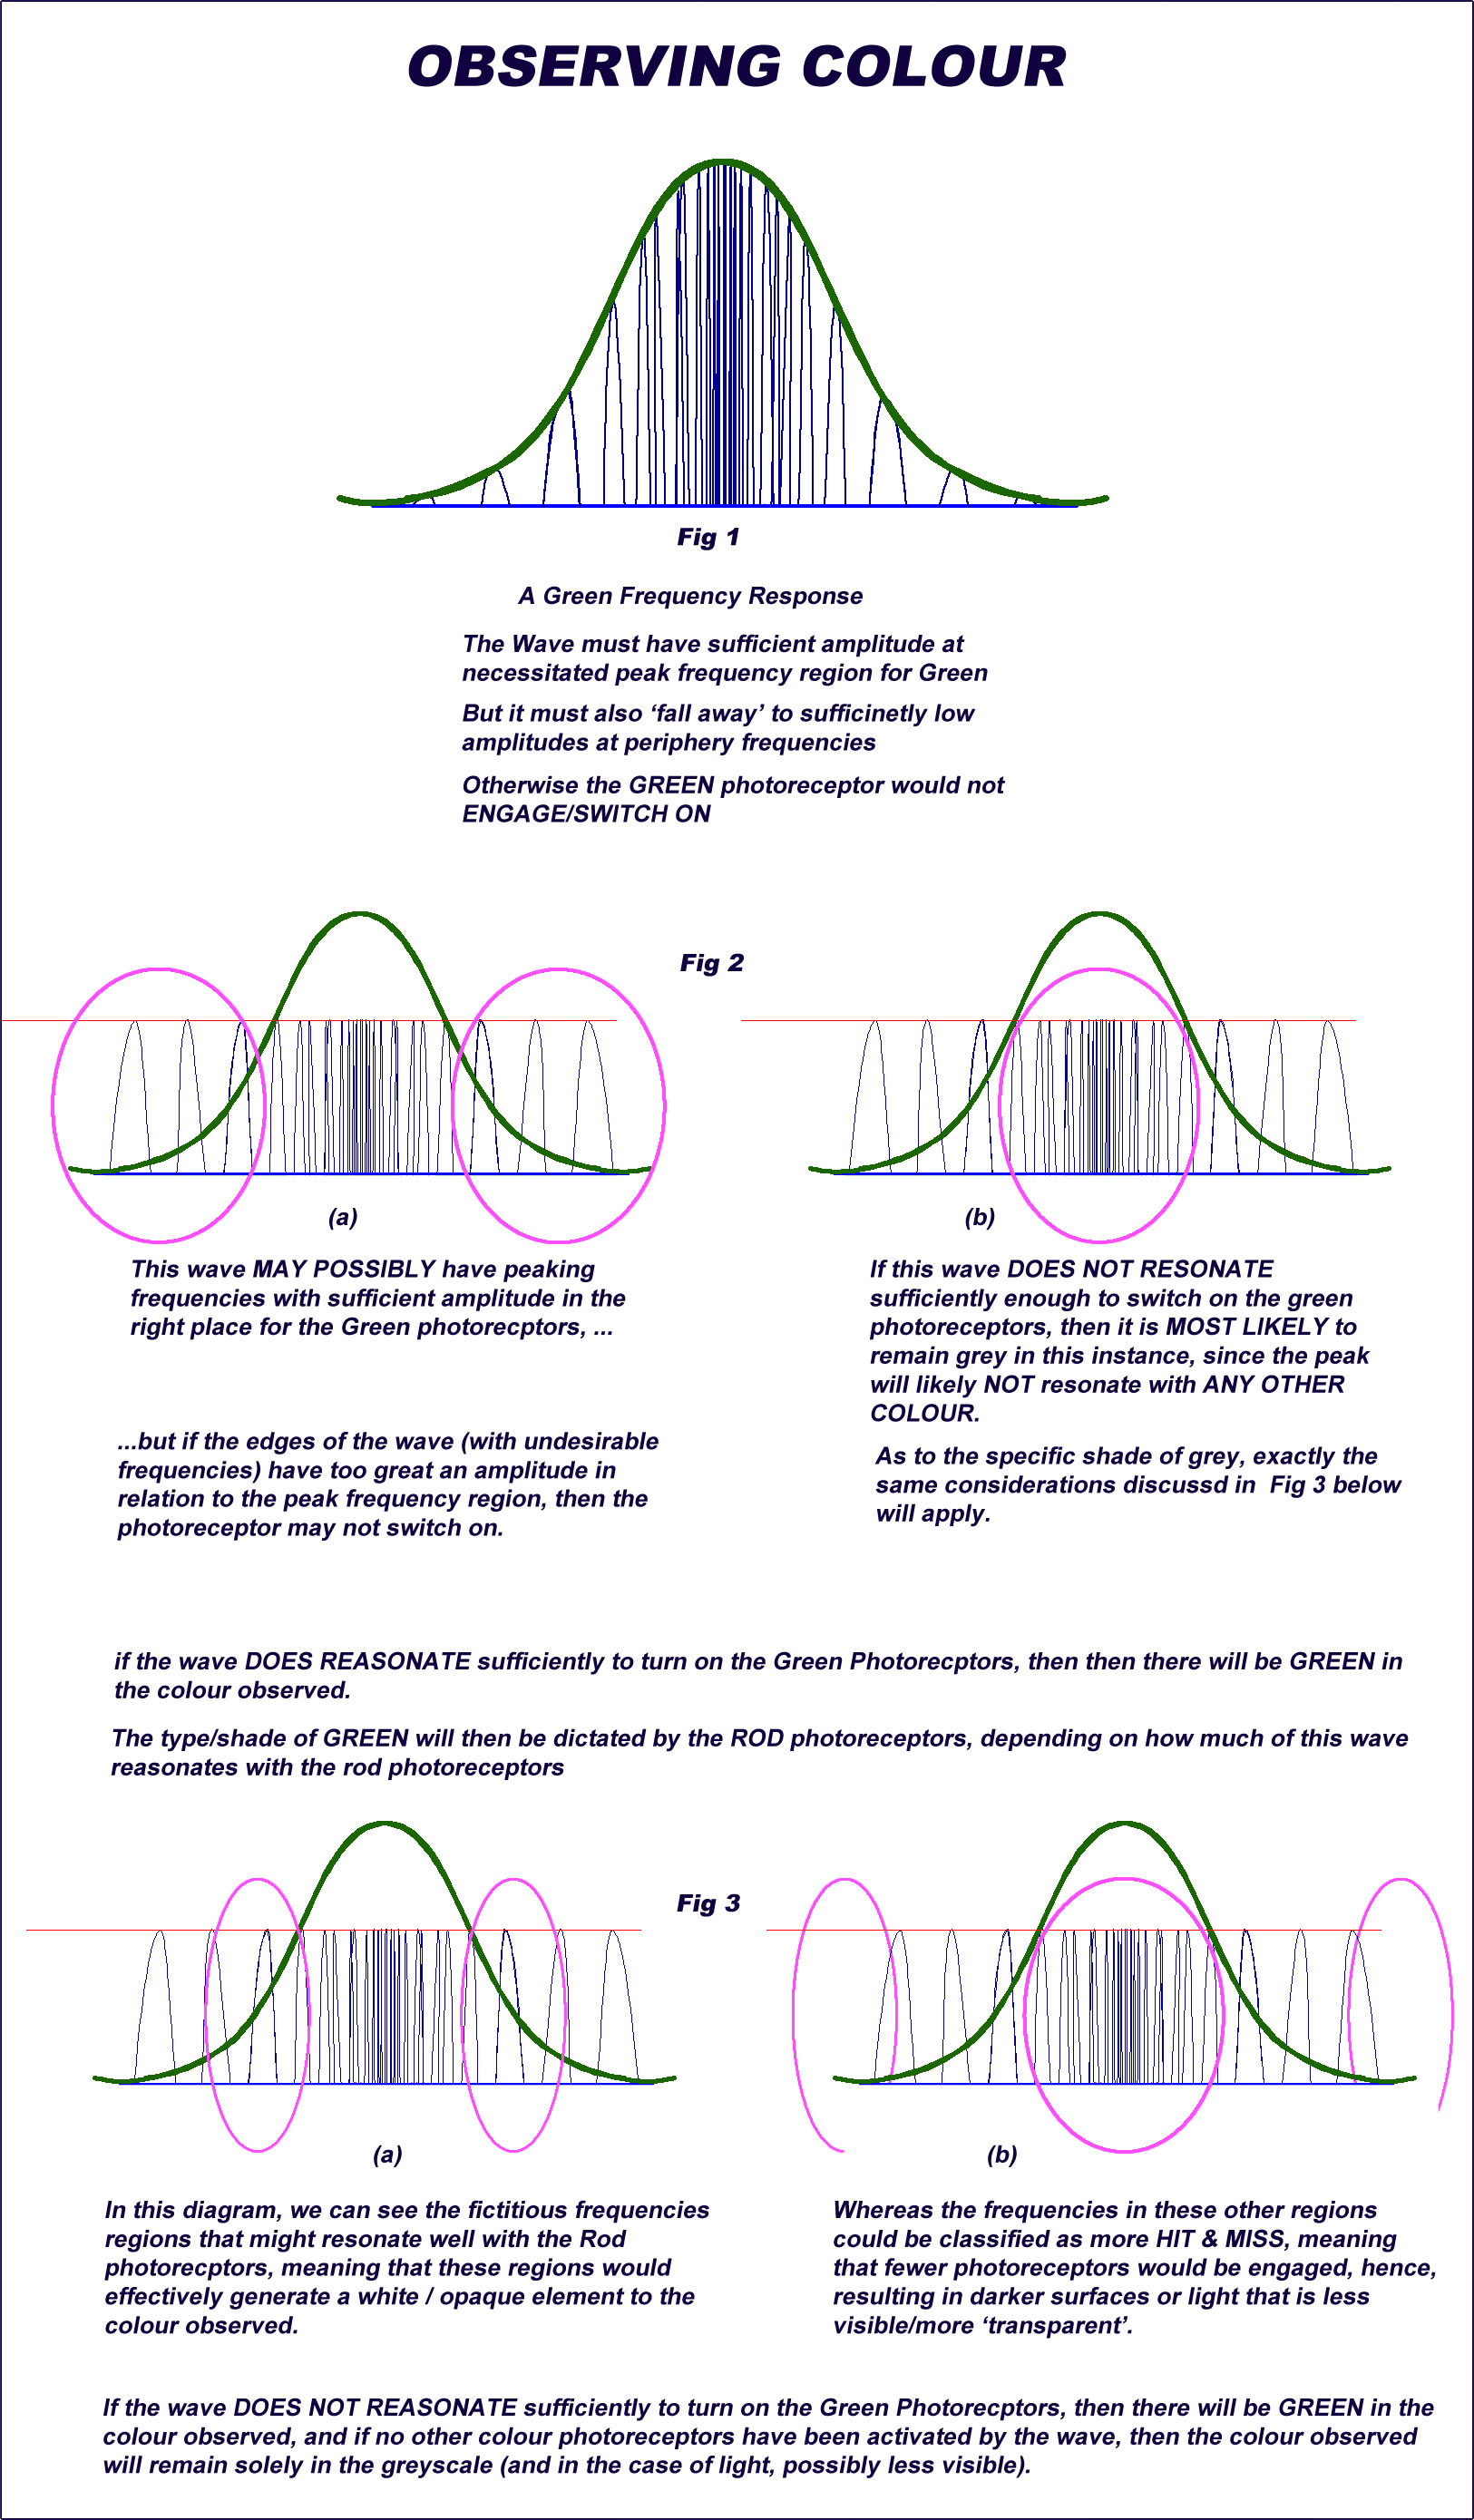
Picture #2 - Colour Observation - using HFMS-Model
(But NOT colour-coded)
20/02/25
[17:40]
ONE TYPE OF COLOUR [DETECTION], TWO TYPES OF BRIGHTNESS AND THREE TYPES OF DARKNESS
ALL ABOUT RESONANCE
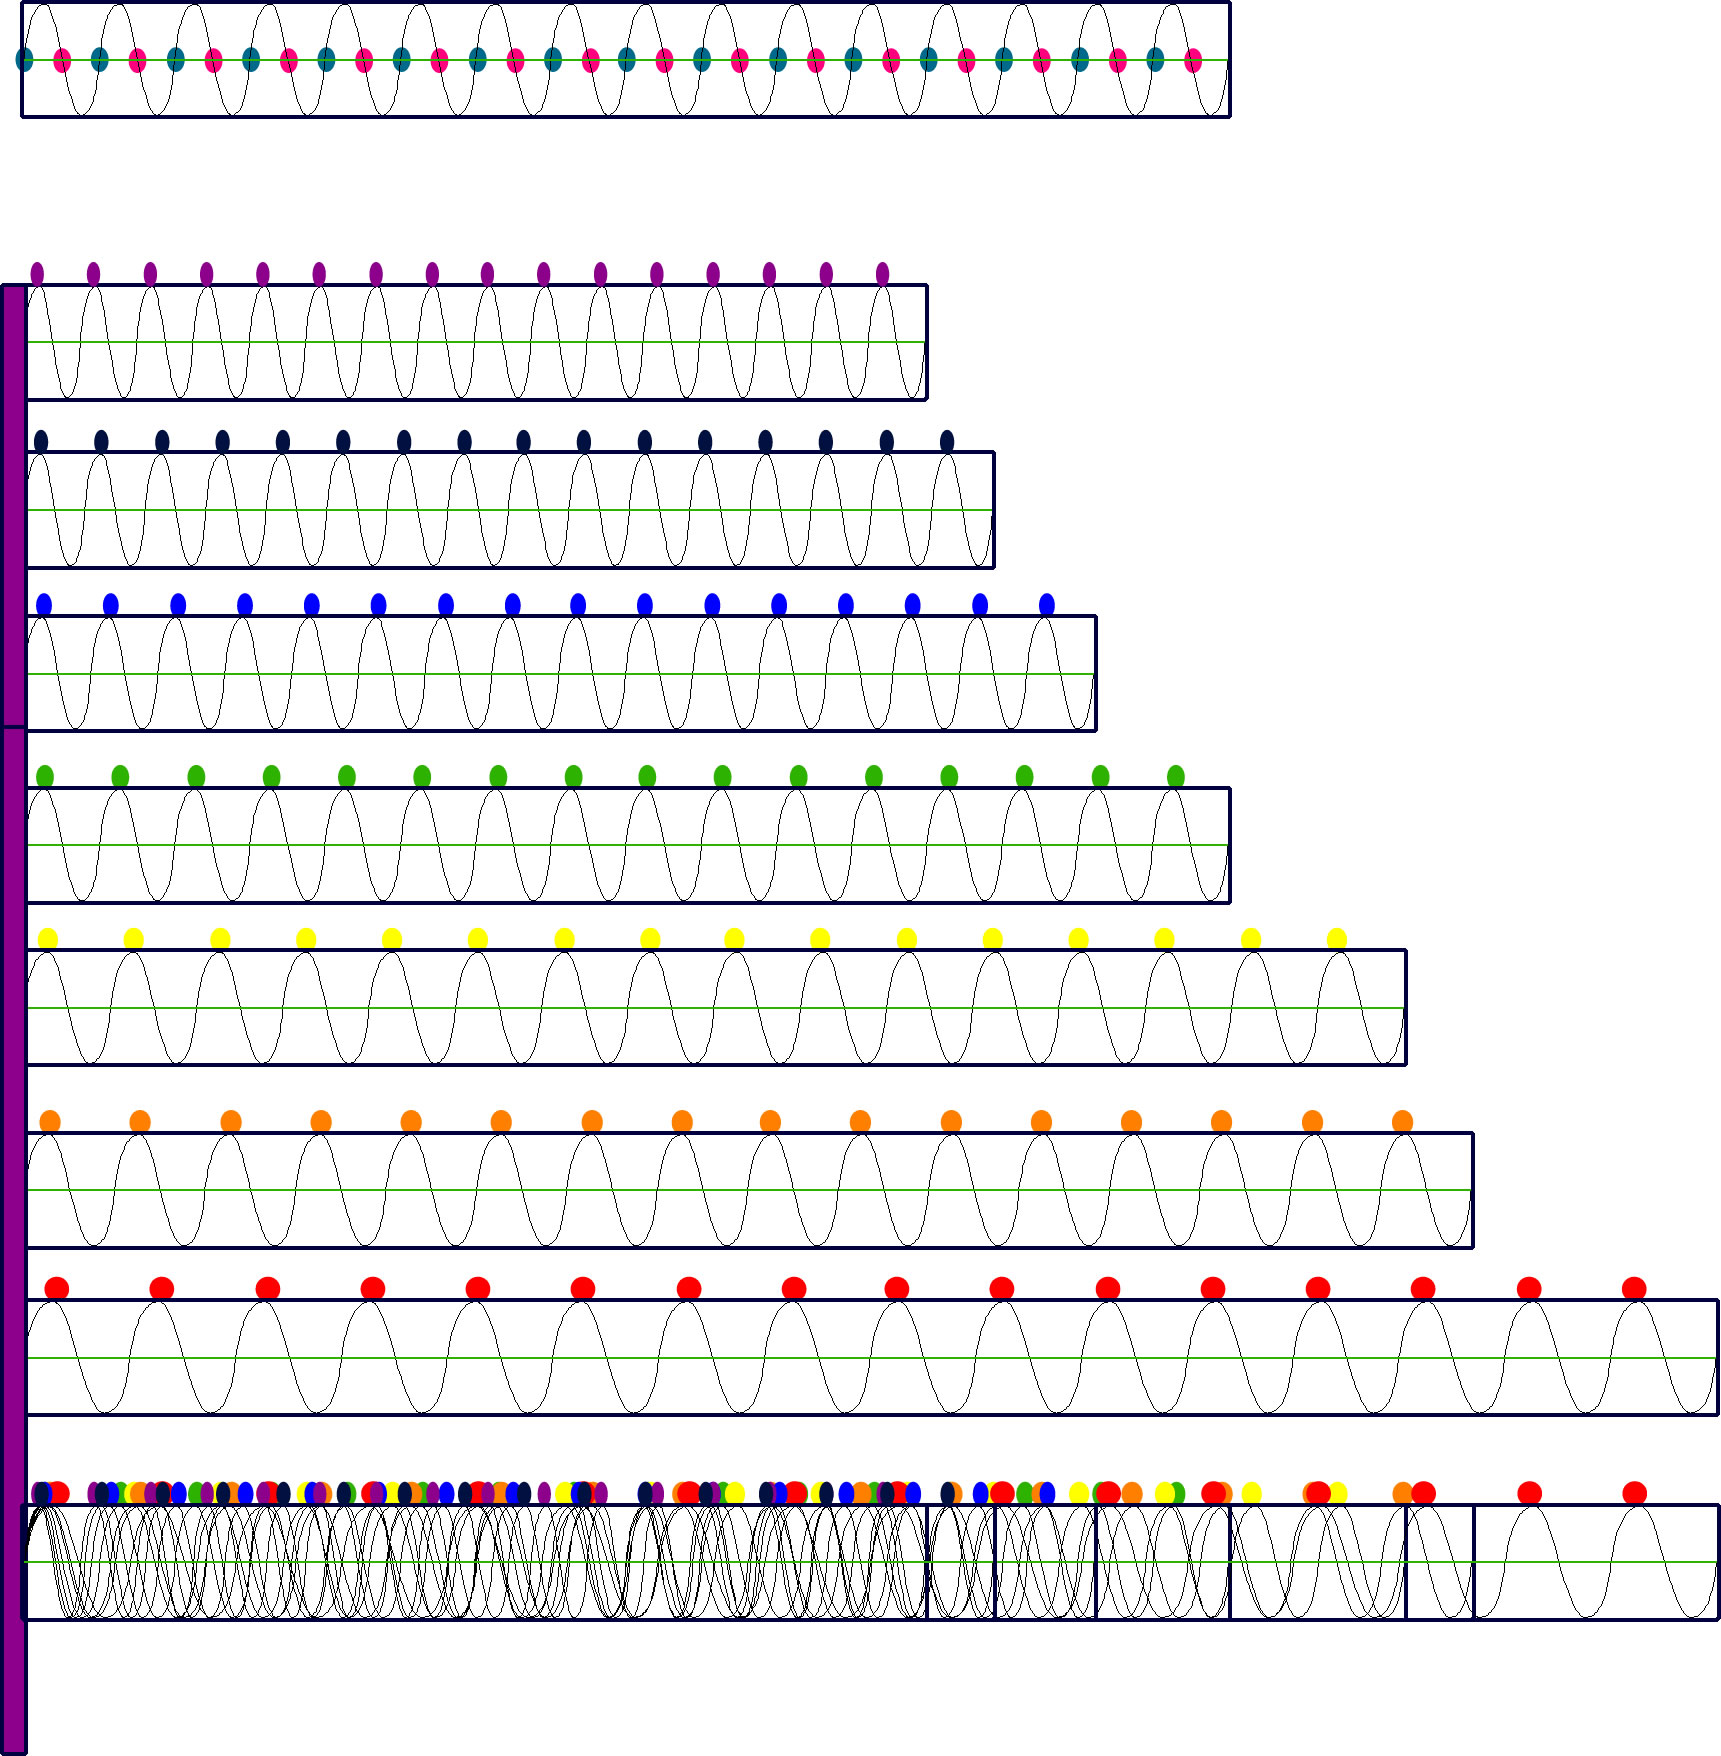
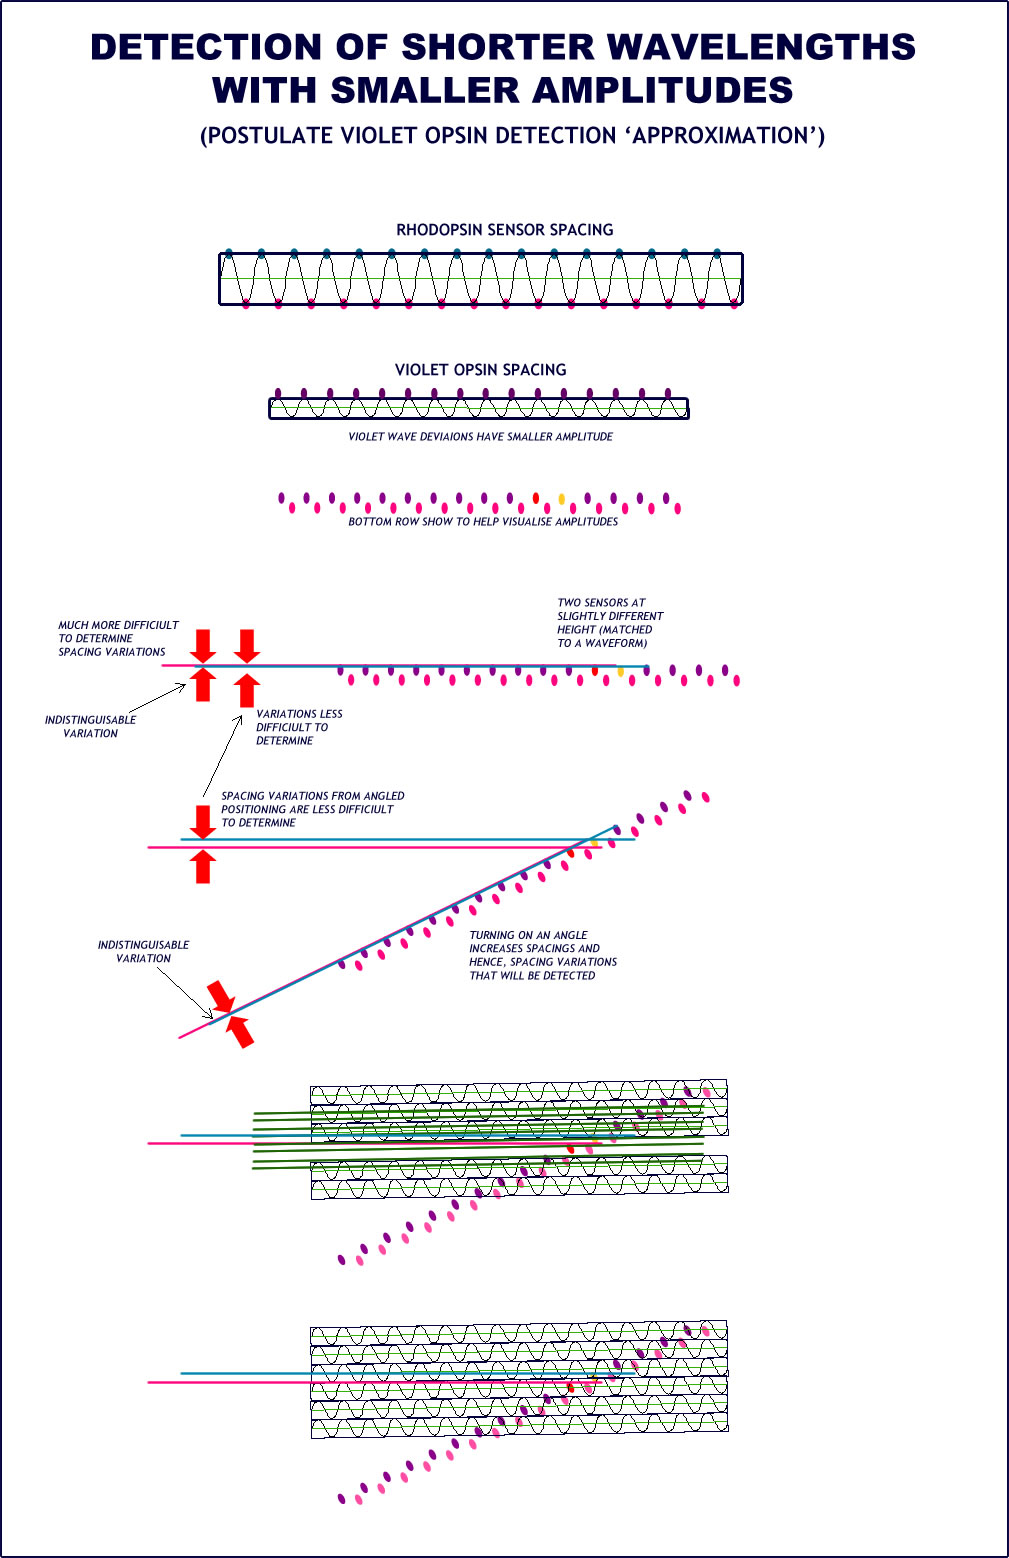
Figure X.1 - Opsin Detector Sensor Spacings
[17:50]
Colour Detectors will have a different spacing each.
And these are not ADDITIVE; They simply do similar check as the rhodopsin, checking for WHITE COLOUR, but in one single parse, either collecting.
To check for white, the some sort of sensors will need to be activated in pairs - with one detecting for a POSITIVE part of the wave and then next detecting for a [zero or] NEGATIVE VALUE.
ONLY IF THE PAIR OF THEM DETECT THESE VALUE TYPES WILL THAT DETECTOR PAIR ACQUIRE A READING.
And this is continued along the whole line of the sensor - which, for rhodopsin, is very long indeed.
[18:10]
It is suspected that the colour detection is NOT activated unless the rods are ALREADY ACTIVATED.
[18:12]
And once the colour sensors are activated, then they will simply execute that single parse of addition across that short length of opsin; which, if there is sufficient resonance, will then produce a valid 'score' to switch that particular colour receptor ON.
[18:14]
Additionally, the light sensors can only detect within a small amplitude range. Thus, if the light was too bright, then the light sensor MAY NOT DETECT THE LIGHT, however, more to the point, the additive nature of the rhodopsin would ensure that eye would be SATURATED in whiteness [light or reflected colour] and thus, you would only see a HIGHLIGHT!
[18:21]
In the diagram shown [pending] we can see that in certain diagrams, the light wave does NOT ENGAGE ALL OF THE SENSORS, and hence, only a few of them would register a value.
These would then be registering different shades of Grey.
I have also included additional shades of grey [likely, relatively bright] which engage the sensors in MULTIPLES of the base frequency, thus, white would engage all sensors, the first multiple would engage every other sensor and the third diagram shows every third sensor [pair] engaging in the sensor detection process.
[18:31]
As the frequency increases significantly, less and less of the actual wave cycles will engage with the pairs of sensors, with more and more full cycles falling between two sensors - to the point where too few sensors are engaged and/or two low an amplitude is recorded for the light level to record a value during the additive process of the rhodopsin.
Hence, in addition to NO LIGHT WAVE AT ALL, this gives us our SECOND DARKNESS RATING.
And similarly, once the wave cycle reaches a maximum length, then this will miss the entire length of the rhodopsin altogether, hence making it completely impossible for ANY PAIR of sensors to be able to register any reading.
And thus, this gives us our THIRD DARKNESS RATING.
[18:45]
And of course, as I have mentioned previously, there are two types of brightness, the first being the one that leads to white - when we have the incident waves optimally at around the same frequency as the sensors / sensor pairs [with an appreciable amplitude] and the second being when the number of sensor pairs activated might be much more spaced out but the amplitude of that fewer number is much greater.
Hence, Q.E.D.
[...or at least, more fully explained].
21/02/2025
[14:49]
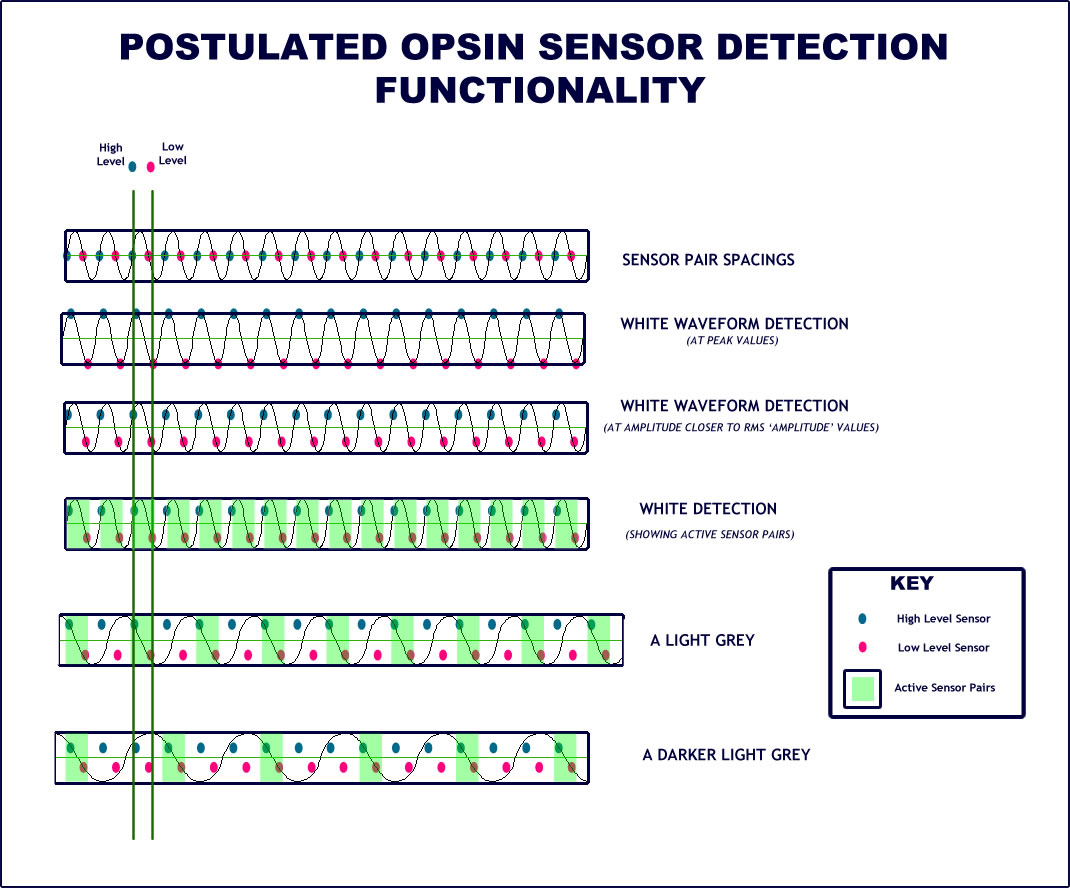
Figure XX1
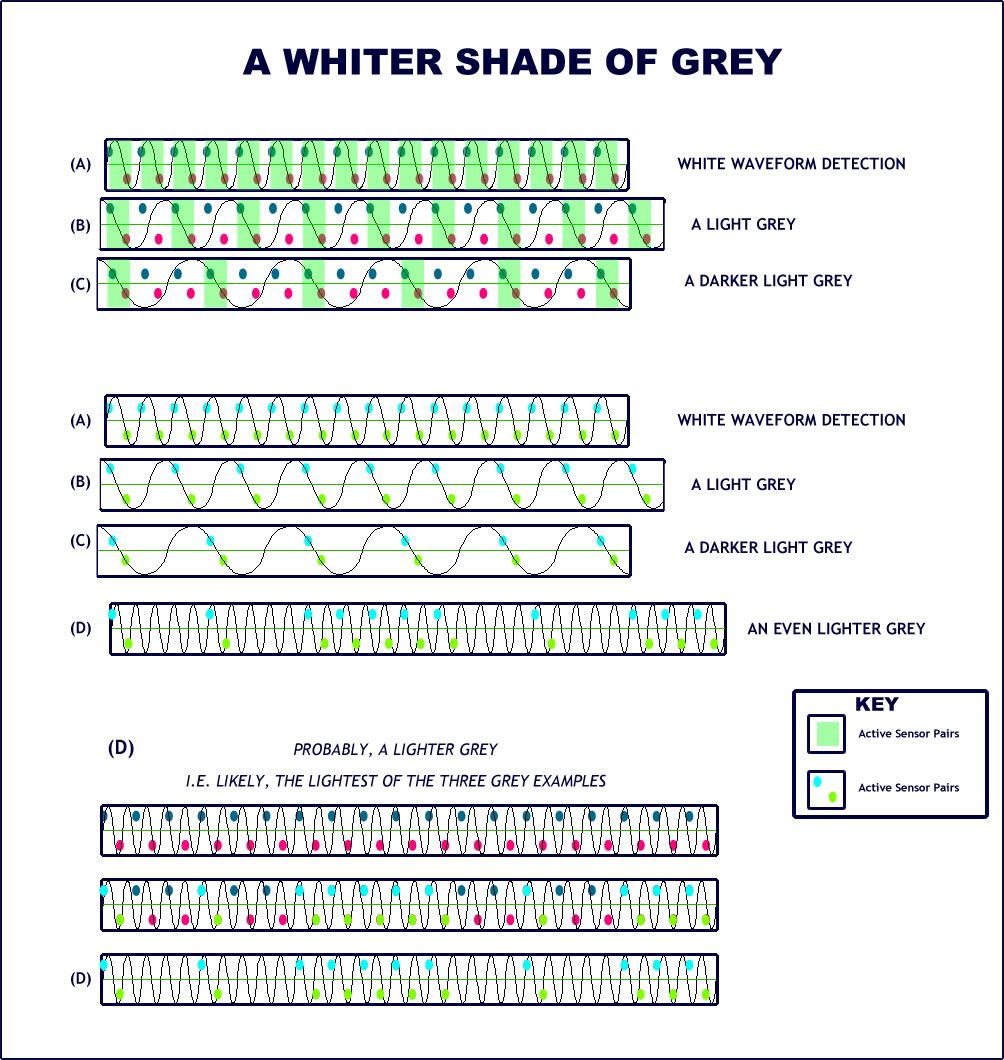
Figure XX2
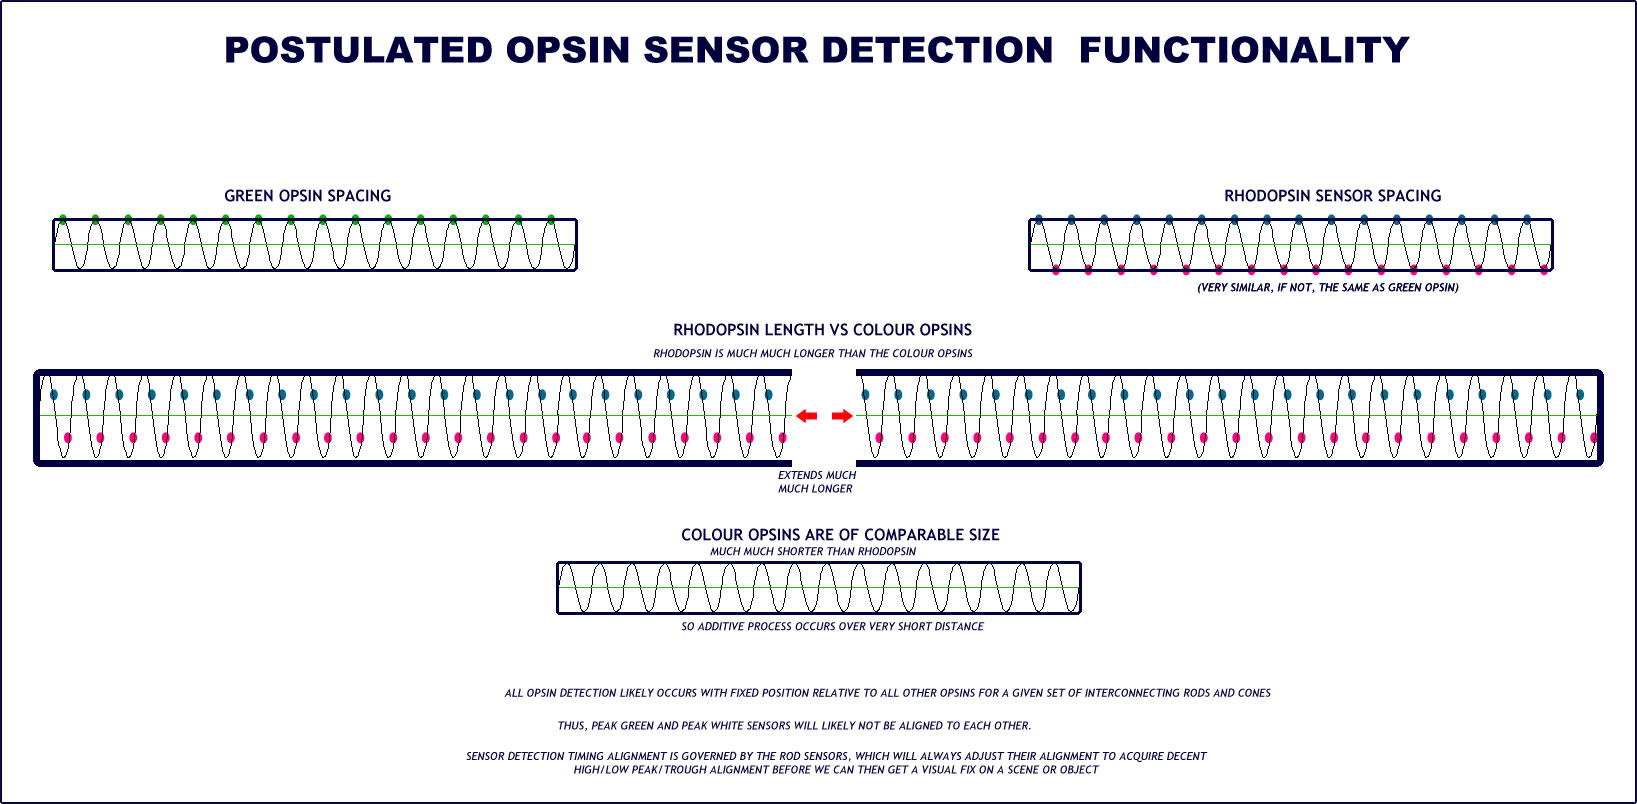
Figure XX3
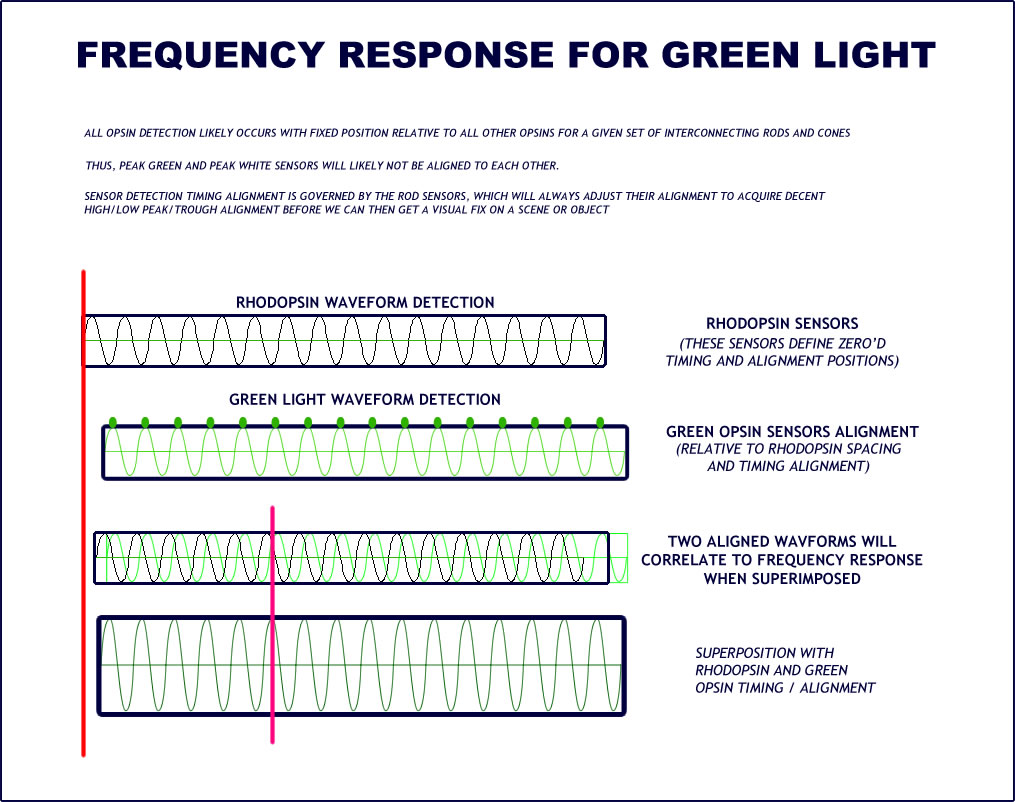
Figure XX4
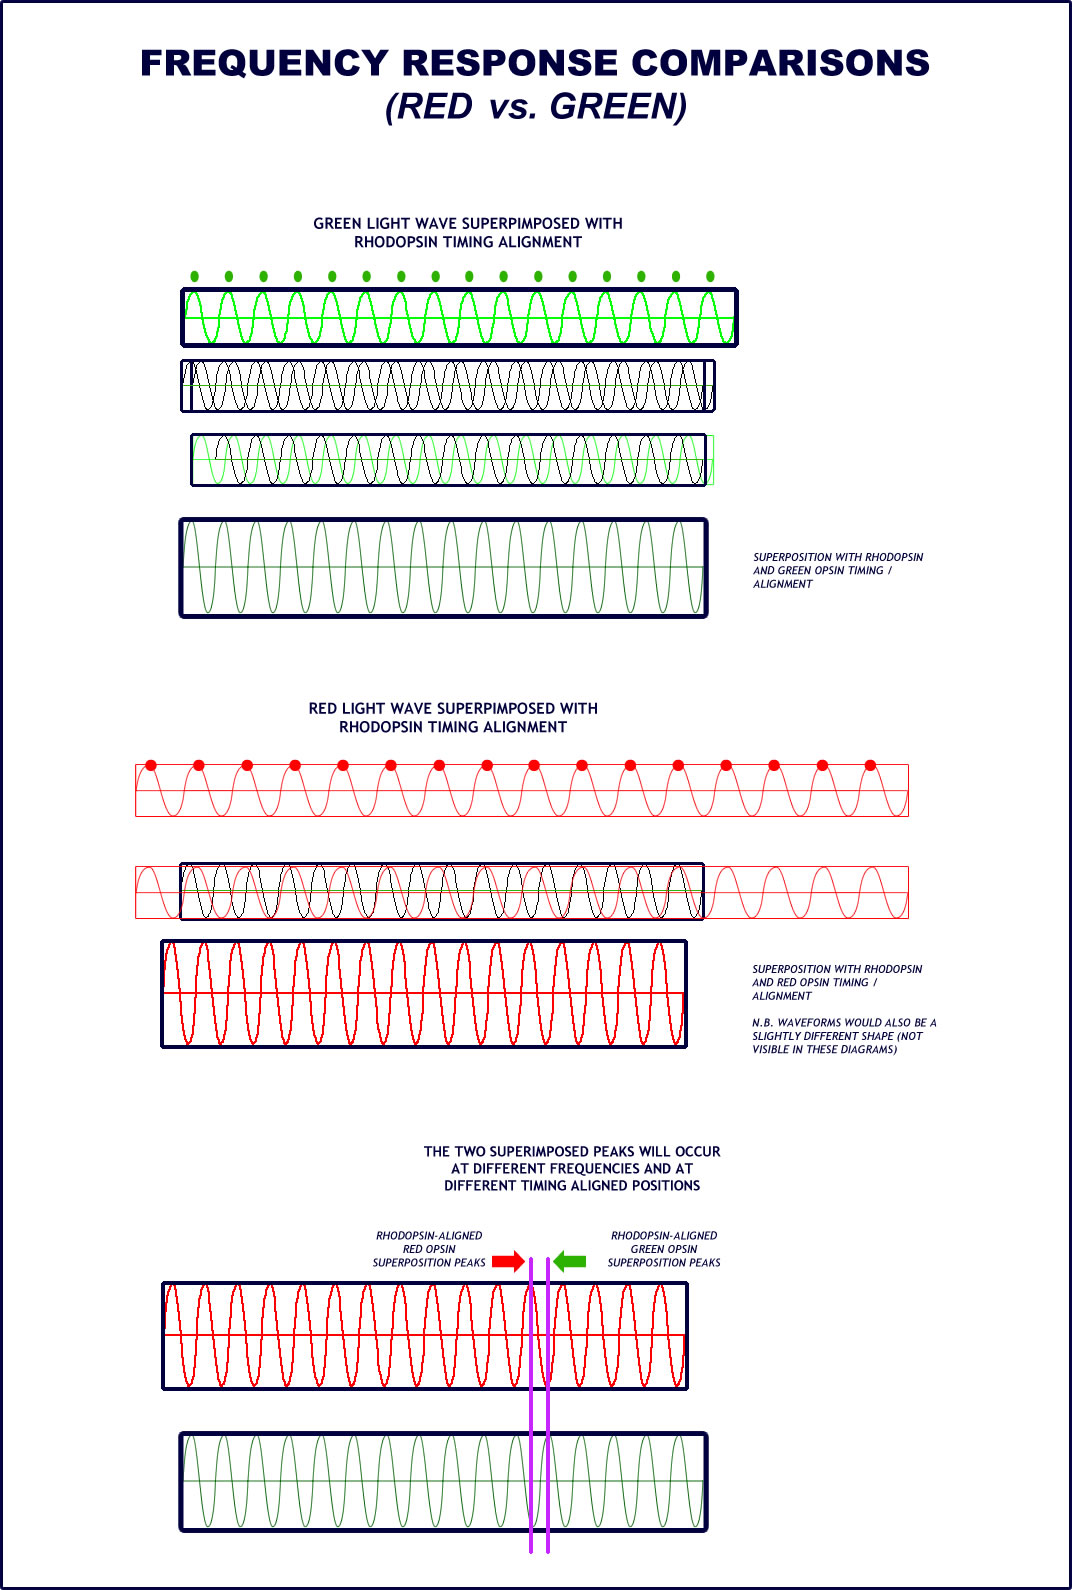
Figure XX5
[18:16]
Figure XX6
The fuller write up has still yet to be provided and will appear on this page at some point in the not-too-distant future.
N.B. MESSAGE PREFACE
20/02/2025
[16:50]
THE TRUTH ABOUT OUR EYERS 1 - 2 - 3 NEW KEY UPDATE ON THE WAY
ONE TYPE OF COLOUR [DETECTION], TWO TYPES OF BRIGHTNESS AND THREE TYPES OF DARKNESS
THIS MESSAGE RELATES TO TOTALLY NEW INFORMATION THAT IS ACTIVELY BEING STOLEN FROM ME AS WE SPEAK.
THE INFORMATION WAS COMPLETED OVER THE COURSE OF TWO OR THREE HOURS UP TO AROUND 16:30 TODAY 20/02/2025. AND THEN, WHEN I THEN TRIED TO LOG ON, MY COMPUTER CONNECTION WAS BEING BLOCKED FROM THE INTERNET, MEANING THAT SOMEONE SOMEWHERE WILL BE TRYING TO LOAD THIS INFORMATION AS THEIR OWN AT AROUND THIS TIME.
THAT IS SOMETHING THAT I WILL LEAVE FOR GREATER POWERS TO DEAL WITH.
IT IS ACTUALLY SUSPECTED THAT A CERTAIN INDIVIDUAL HAS BEEN MOVING TO DIFFERENT PLACES AROUND THE WORLD WHILST STEALING MY INFORMATION AND THEN, PERSISTENTLY GETTING TARGETED BY GREATER POWERS, LEAVING A TRAIL OF DESTRUCTION BEHIND THEM.
AND NOW, IT IS SUSPECTED THAT THEY HAVE DECIDED TO SECRETLY RELOCATE TO WITHIN METERS OF MY HOME, ASSUMING THAT THIS WILL MAKE THEM TOTALLY SAFE AND IMPERVIOUS FROM ANY ACTION TO BE TAKEN BY GREATER POWERS; SPECIFICALLY SO THAT THIS PERSON/PARTY CAN THEN CONTINUE TO STEAL MY INFORMATION.
THUS, IF THIS DOES PROVE TO BE TRUE, THEN I SHALL SIMPLY LEAVE IT FOR THEM TO FIND OUT THE HARD WAY THAT USING THE CHRIST AS A HUMAN SHIELD DOES NOT NECESSARILY GUARANTEE ONE'S SAFETY TO THEN ENGAGE IN UNLIMITED SACRILEGIOUS INIQUITY.
